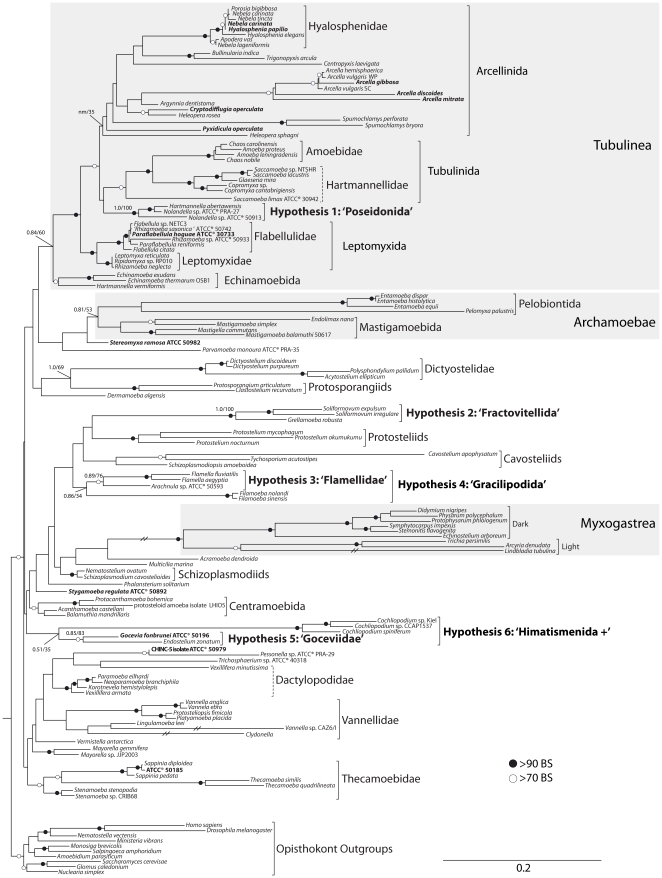
Figure 3. Phylogenetic reconstruction of the Amoebozoa, based on concatenated analysis of SSU-rDNA and actin genes of 139 lineages.
This reconstruction is the best maximum likelihood tree obtained from the dataset Manual139, which we consider exhibits the optimal combination of tree indices and taxonomic coverage. Both Bayesian posterior probabilities and bootstrap supports are plotted on branches of interest. Branches without any support indication had bootstrap support of less than 70. The three well-supported higher-level groupings are shaded gray. The lower-level, morphologically consistent relationships are indicated. The novel relationships uncovered in the current study are in bold, and the suggested name for the group is shown in single quotes. Terminals in bold indicate lineages for which we are providing novel molecular information. Dashed brackets represent lower-level groups that are morphologically consistent but not recovered in this reconstruction. All branches are drawn to scale, except the branches leading to Myxomycetes, Lindbladia, Vannella CAZ6/I and Clydonnella which were trimmed to half-length for display purposes.

