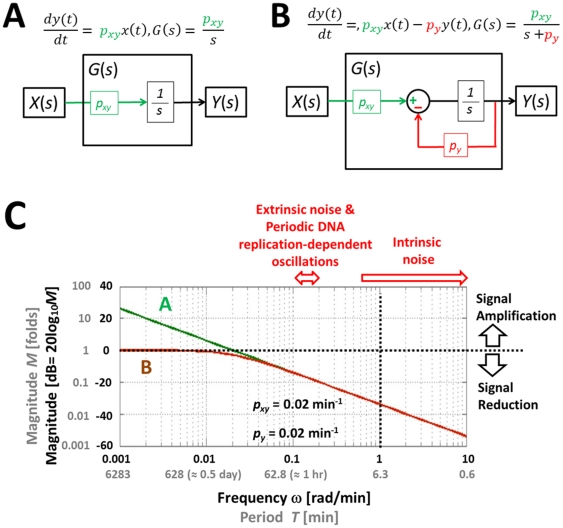
Figure 5. Simple gene regulation with and without the degradation/dilution term of Eq. 1.
(A) The ODE, transfer function, and block diagram of simple gene regulation in which the second or degradation/dilution term is removed. (B) The ODE (equivalent to Eq. 1), transfer function, and block diagram of simple gene regulation with the second term intact. Note that the block diagram has a negative feedback component, which could be hardly revealed by examining Eq. 2. (C) The Bode plot for (A) and (B). The figure illustrates that low-frequency signals are increasingly amplified as their frequencies decrease in the case of (A). On the other hand, (B) exhibits a “plateau-like” curve (brown), indicating that the amplifying magnitude remains constant regardless of the frequency decrease. Note that their capabilities to filter intrinsic noise and other types of fluctuation are quite similar.

