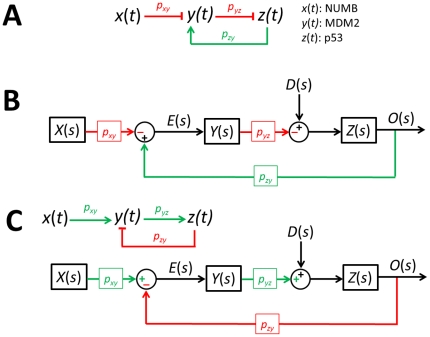
Figure 7. p53 network.
(A) Schematic drawing of the p53-network. (B) Block diagram representation. X(s), Y(s), and Z(s) are the Laplace transform of x(t), y(t), and z(t), respectively. O(s) is the Laplace transform of the output and E(s) is the transform of an error e(t), which is the difference between the input and output. D(s) is a disturbance representing fluctuations exerted on p53. (C) A network configuration discussed in Figure 3B . It has an equivalent oscillation filtering effect as the configuration shown in (B).

