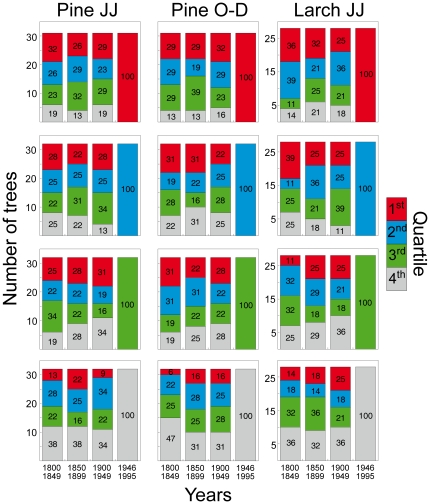
Figure 4. Time-varying ranking of the individual climate-growth relationships.
Distribution within the first three 50-yr periods (1800–1849, 1850–1899 and 1900–1949) of the individual bootstrap correlations between indexed tree-ring width and seasonal means (current year June–July for stone pine and larch and previous year September to December just for stone pine) for the trees falling into a specific (first to fourth) quartile in the most recent 50-yr period (1945–1995). Numbers inside bars represent the percentage of trees within each quartile.

