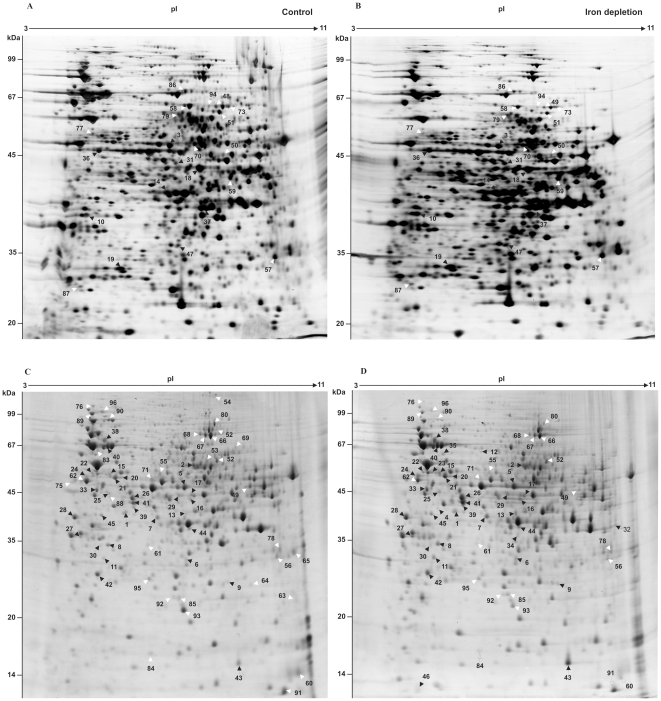
Figure 4. P. brasiliensis protein regulation during iron limiting conditions detected using 2D-gel analysis.
2D-gel analysis of P. brasiliensis proteins extracted from yeast cells grown in iron depleted media for 6 hours (B) and 24 hours (D). Gels A and C represent iron rich conditions. Black and white arrows indicate up-regulated and down-regulated proteins respectively. Identified protein spots are numbered and listed in Tables 1 and 2.

