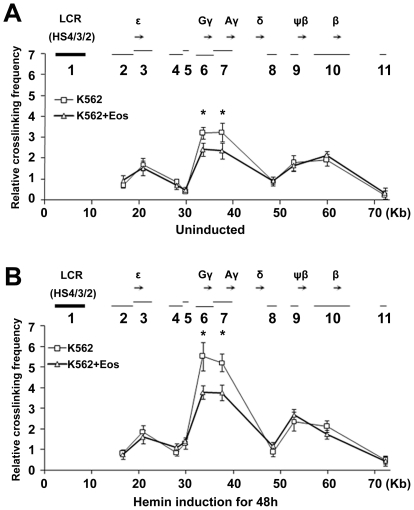
Figure 5. Eos decreases the interaction between the LCR and the γ-globin region promoters.
(A–B) The human β-globin locus was analyzed by 3C assay in K562 cells that were (A) untransfected or transfected with pcDNA3.1-Eos, or (B) that were untransfected or transfected with pcDNA3.1-Eos and hemin-induced for 48 h. The relative positions of β-like globin genes are represented as black arrows along the top of each graph. The thick line (1) indicates the position and size of the fixed fragment 1 (LCR HS2/3/4), and the thin lines (2–11) show the position and size of other XbaІ fragments. Data are presented as mean ± SEM (n = 3) cross-linking frequencies between the LCR (HS2/3/4) and differentiation fragments, Error bars represent one standard deviation. *P<0.05.

