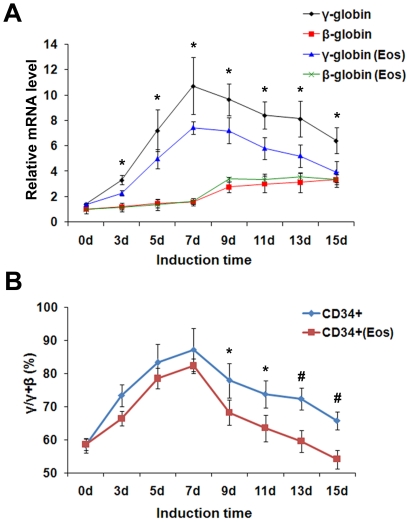
Figure 7. The effect of Eos on γ- to β-globin gene switching during erythroid differentiation.
(A) Kinetics of γ- and β-globin gene expression during the erythroid maturation of CD34+ HPCs. “Eos” represents CD34+ HPCs infected with lentiviruses carrying Eos. (B) Ratio of γ to [γ+β] mRNA during the erythroid maturation of CD34+ HPCs. Quantitative real-time PCR assays were performed in triplicate and were normalized to β-actin mRNA levels. Data were obtained from three independent experiments, and error bars represent standard deviation. *P<0.05, #P<0.01.

