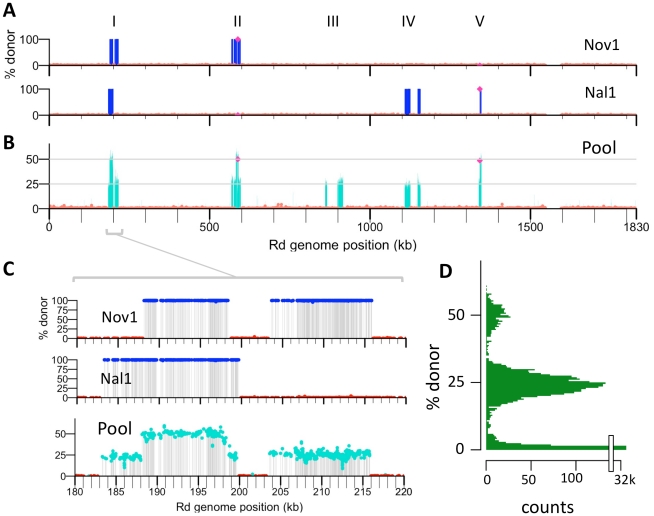
Figure 4. Identifying transformation events genome-wide.
(A) Donor allele frequency at cross-validated SNVs in the Nov1 and Nal1 transformants plotted against recipient genome position. Donor SNVs are blue and recipient SNVs are red. Roman numerals indicate intervals where transformation was detected in either A or B. The selected NovR and NalR alleles in intervals II and V are purple. (B) Donor allele frequency at cross-validated SNV positions in the pool of four transformants (Nov1, Nov2, Nal1, and Nal2) plotted against recipient genome position. Coloring as in A, with turquoise used for intermediate donor allele frequencies. (C) Expanded view of interval I, as in A and B. All five intervals are shown in Figure S7. (D) Histogram of the donor allele frequency at cross-validated SNV positions in the pool of four transformants mapped to the Rd reference.

