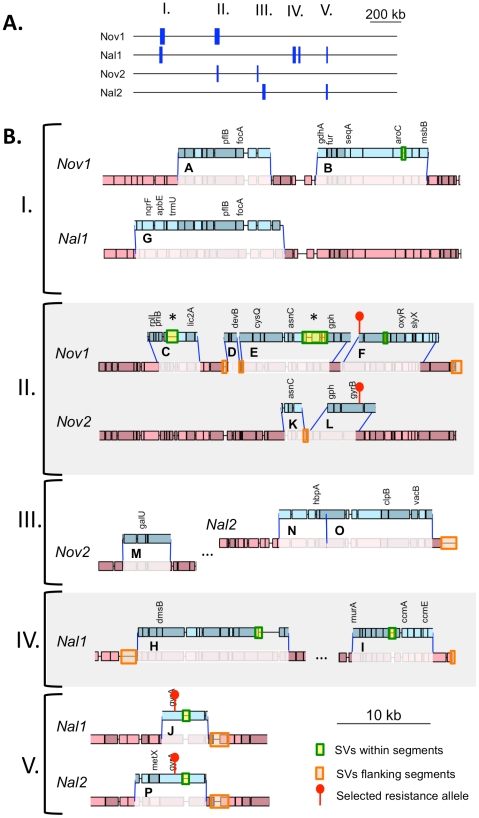
Figure 5. Recombination events detected in four transformants.
(A) Summary of donor segments in each transformant are illustrated as blue bars. (B) Detailed illustrations of recombination tracts in each interval showing gene annotations. Donor segments are shown in blue, and recipient sequences are shown in red. Pale shading indicates genes on the plus strand and dark shading indicates genes on the minus strand. Dark blue lines joining donor and recipient segments indicate recombination breakpoints. The key in the lower right shows additional annotation of the selected antibiotic resistance alleles and the locations of structural variation between the genomes. Exact donor segment breakpoints and additional data on each segment are provided in Table S9 and Table S10 for the Rd and 86-028NP genome coordinates, respectively. Scale bars are shown for both (A) and (B).

