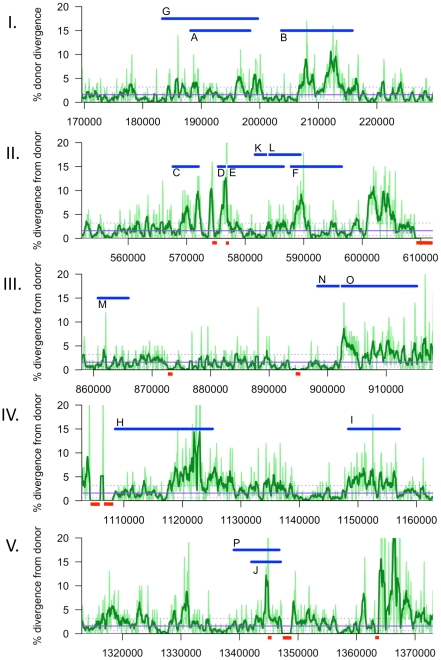
Figure 6. Sliding window analysis of % nucleotide divergence across the five intervals containing recombination tracts, I to V.
Donor segments are shown as horizontal blue bars. Dark and light green lines indicate 1 kb and 250 bp window sizes, respectively (both with a step size of 100 bp). The solid purple line shows the median genome-wide divergence, and the dotted purple lines shows the 25% and 75% quartiles. Red bars below the axis indicate positions of large recipient-specific sequences (deletions in the donor), where the % divergence is artificially reduced to 0%. The spacing between Segments D/E, K/L, and N/O are not to scale, so that the position of putative restoration repair are clearly visible.

