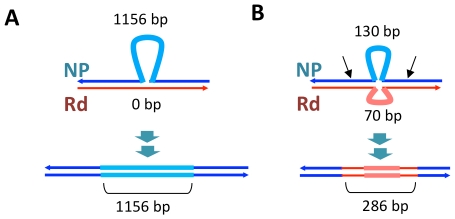
Figure 7. Transformation at structural variation.
The top drawings illustrate the inferred joint molecule intermediates that yielded the recombination products illustrated in the bottom drawings. In (A) the 1.2 kb insertion in Segment C is shown, and in (B) the putative restoration repair at an insertional deletion disrupting Segments D and E is shown. Thin dark lines show aligned sequence (blue and red for donor and recipient sequences, respectively). Thick pale lines show unaligned indel differences between the genomes. For B, black arrows show putative cut sites by a mismatch correction endonuclease.

