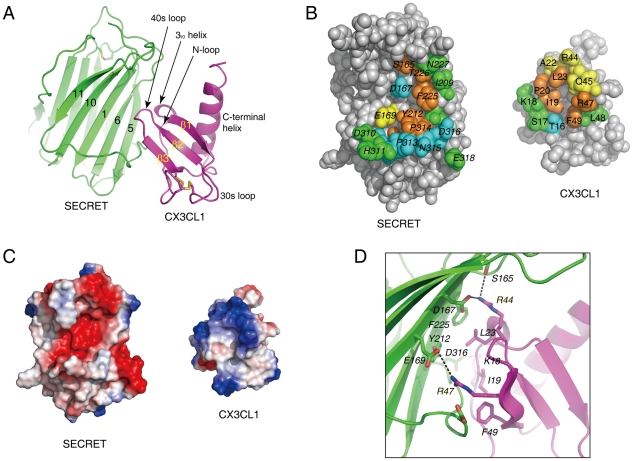
Figure 4. Crystal structure of the SECRET/CX3CL1 complex.
(A) Ribbon diagram of the SECRET domain (green) in complex with CX3CL1 (purple). (B) Residues at the binding interface. Residues with solvent accessible surface decrease of above 80%, 60–80%, 40–60%, and below 40% upon complex formation are colored in brown, cyan, yellow, and green, respectively. (C) Electrostatic complementarity at the binding interface. The SECRET domain and CX3CL1 are in the same orientation as in panel B. D) Detailed view of the interactions at the binding interface. Hydrophilic interactions around basic residues K18, R44, and R47 of CX3CL1 are shown as dashed lines.

