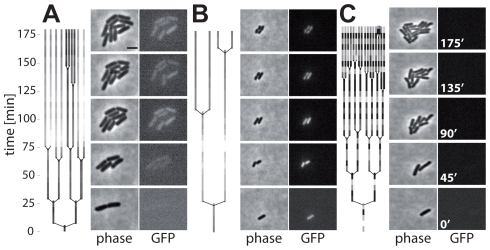
Figure 4. Time-lapse microscopy shows onset of ttss-1 expression and concomitant growth retardation.
Lineage trees with corresponding phase contrast and GFP images of S. Tm (M556; psicA-gfp) grown on agar pads with spent LB. Coloring of the lineage trees reflects the relative mean GFP intensity of individual cells (dark = low; light = high; scaled to the highest fluorescence in tree). A) On-switching of ttss-1 expression in a fraction of the micro colony. B) Micro colony uniformly expressing ttss-1 throughout the assay. C) Micro colony not expressing ttss-1 throughout the assay. Scale bar, 2 µm; see also Fig. S4.

