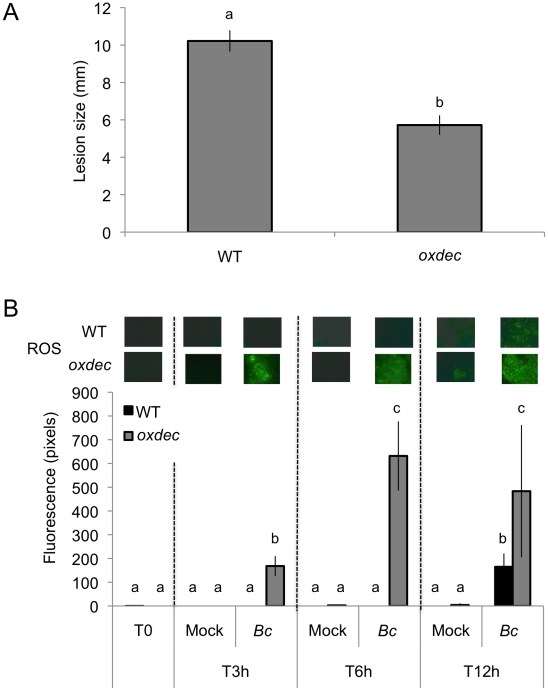
Figure 10. Effect of OXALATE DECRABOXYLASE over expression in A. thaliana on resistance to B. cinerea and ROS production.
(A) Resistance displayed by T3 A. thaliana lines over expressing the OXALATE DECARBOXLYLASE gene from T. versicolor (oxdec plants); all plants were previously checked for the over expression of the oxalate decarboxylase activity (n = 130; ±SE). Different letters above each bar represent statistically significant differences (Dunn's test; P<0.05). (B) Densitometric quantification of ROS production at 3, 6, 12 h post inoculation with B. cinerea (Bc) and mock in oxdec plants compared to the WT. After treatment, all plants were kept under humid conditions. Low level of fluorescence density in the WT is detected only after B. cinerea at 12 h post inoculation and not in the mock treatment. For ROS production (n = 4; ±SD), one representative image of the fluorescent leaf surface was placed above each histogram as a visual illustration. Different letters above each bar represent statistically significant differences (Dunn's test; P<0.05).

