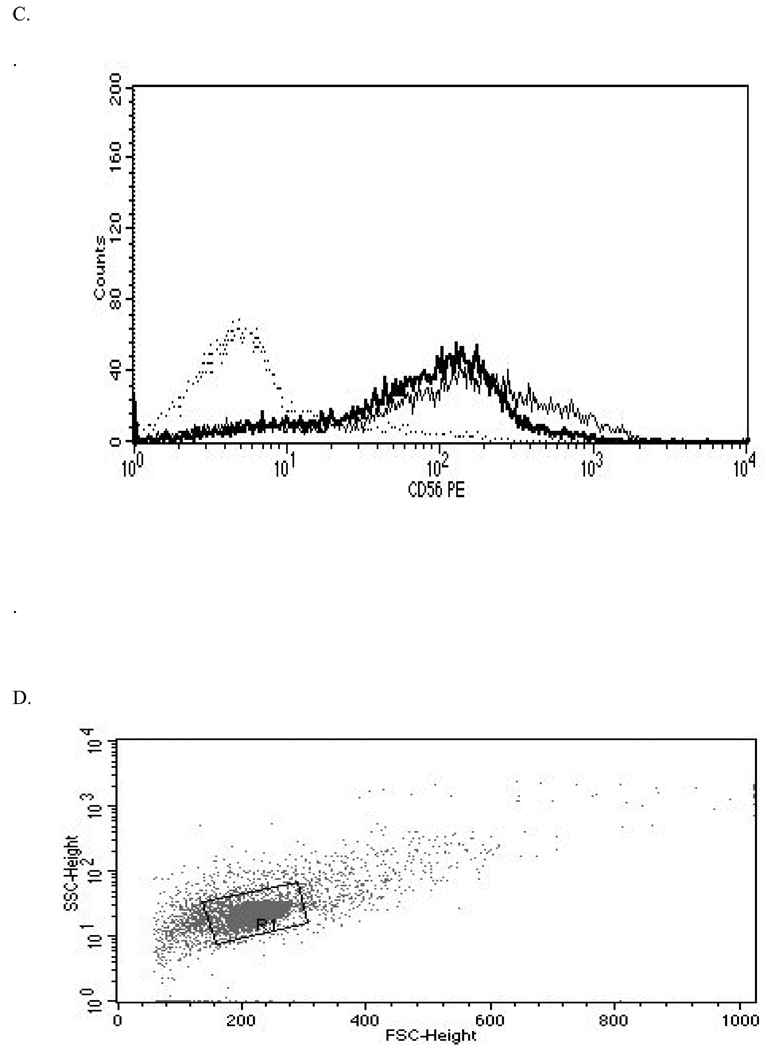
Figure 4. Representative histograms from studies of effects of 48-hr exposures to 2.5 µM TBBPA on NK cell surface protein expression.
(A) CD2 (control MFI = 123.71, TBBPA MFI = 79.36); (B) CD16 (control MFI = 678.42, TBBPA MFI = 442.22); and, (C) CD56 (control MFI = 277.39, TBBPA MFI = 154.74). Dotted line = IgG control; thin solid line = control NK cells + appropriate antibody; bold line = TBBPA-exposed cells + appropriate antibody. Y-axis = cell number; X-axis = fluorescence intensity. (D) Dot-plot of cell preparation used in experiment.


