


Figure 2. Inverse relationships between gestational ages and ages of diagnosis of NEC.
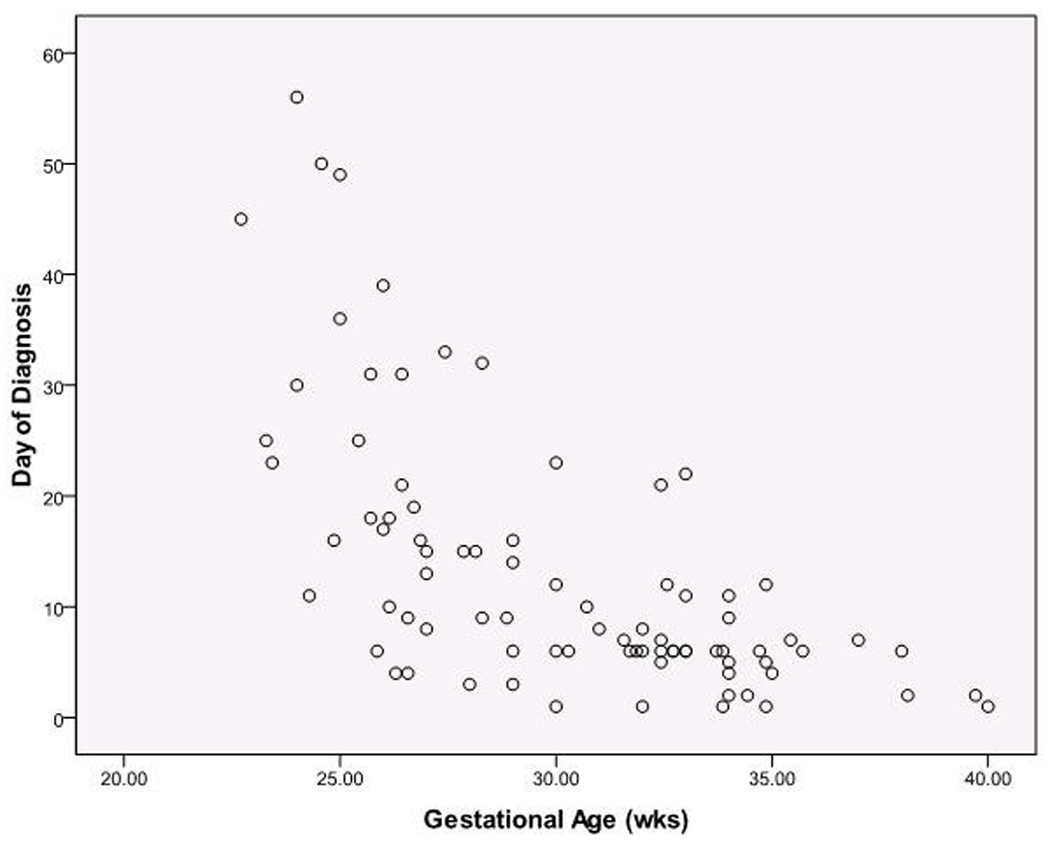
Scatter plot for all subjects. N= 84. The regression model including GA and 1/(GA) explains 50.3% of variation in day of diagnosis and significantly improved fit (p=0.0134).