
Figure 4. Application of Sartwell’s log normal model: Cumulative distribution for log normal distribution of age of NEC diagnosis10.
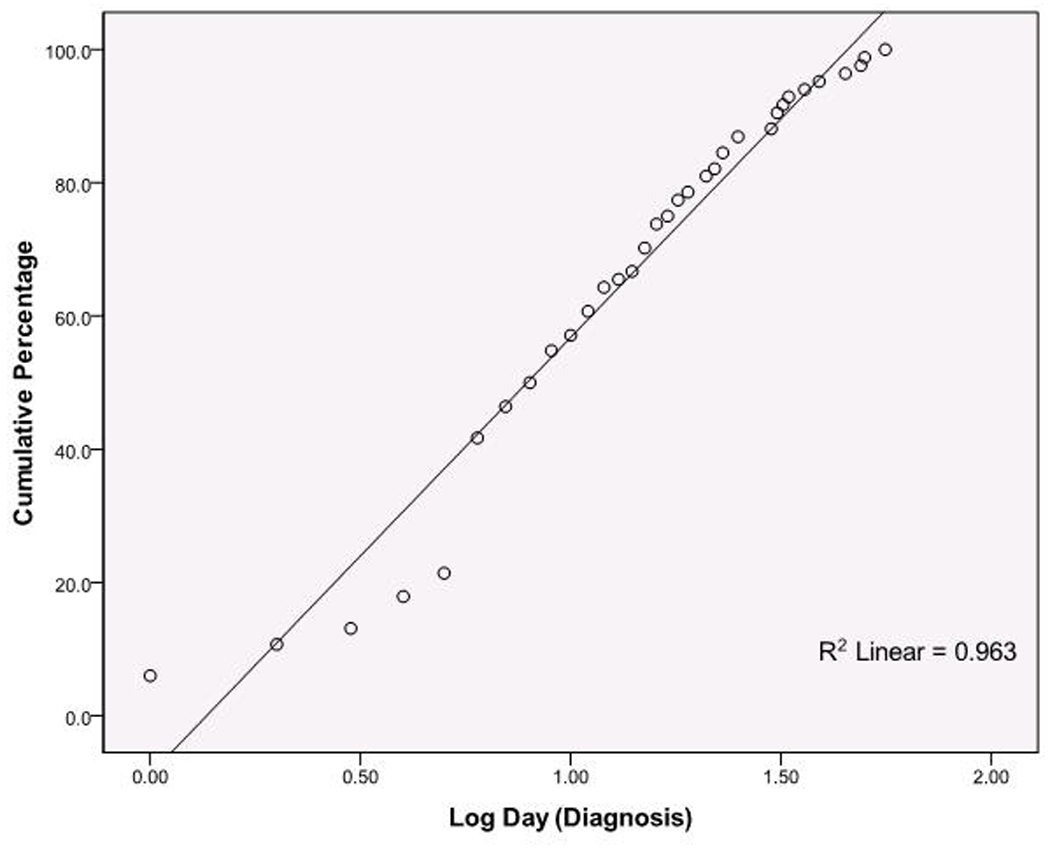
The y axis represents cumulative percentages of cases; the x axis represents the time scale, expressed as log10 values. Each point represents all the NEC cases presenting at the given time point. These are plotted by the cumulative percentage they represent (y axis). N=84, Shapiro-Wilk test p > 0.05 indicating significant fit to predicted log normal distribution.