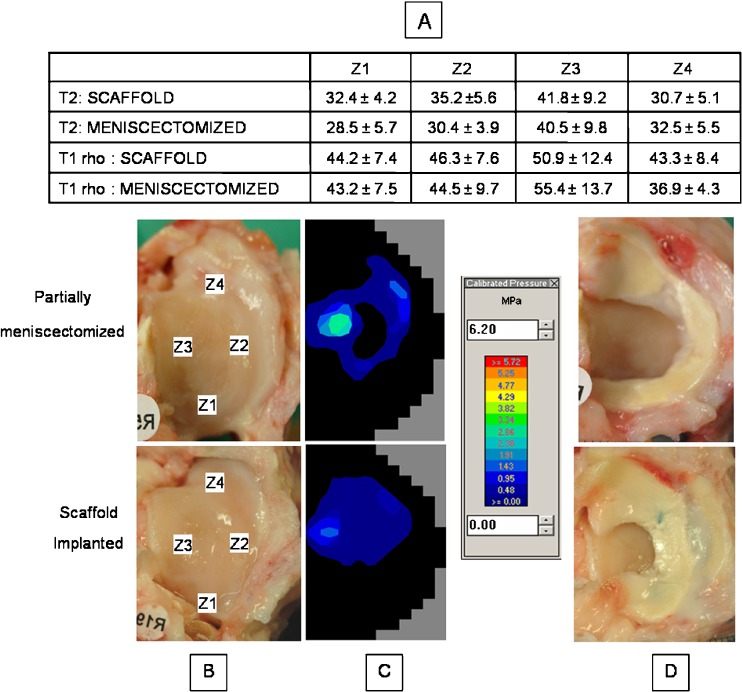
Fig. 3.
Representative images of knees from both groups are shown illustrating the a distribution of T2 and T1rho values across the four zones for the tibial plateaus of each group. b Gross photographs of representative tibial plateaus are included and the zones used for MRI analysis are labeled. c The representative contact stress distributions for each condition are depicted. d These photographs show the gross appearance of knees with the menisci intact

