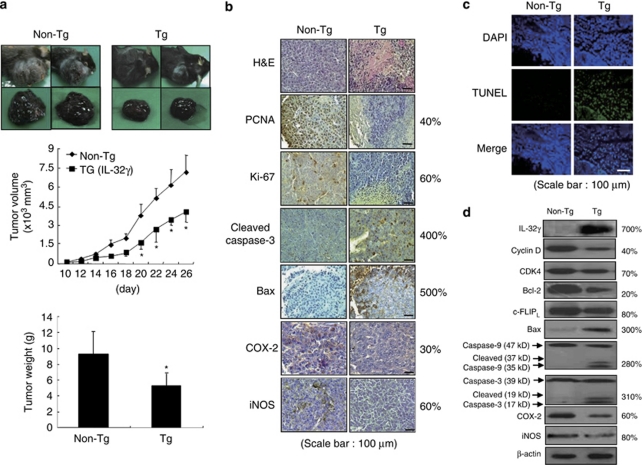
Figure 2.
Effect of IL-32γ on tumor growth in IL-32γ-overexpressing transgenic mice. (a) Tumor images, volumes and weights. The results are expressed as mean±s.d. *P<0.05 compared with the non-transgenic mice. (b) Tumor sections were analyzed by immunohistochemistry. (c) Apoptotic cells were examined by fluorescence microscopy after TUNEL staining. (d) Tumor extracts were analyzed by western blotting. Each image and band is representative of three independent experiments. The values on the right of panels b and d are average percentages of vector control over three independent experiments.

