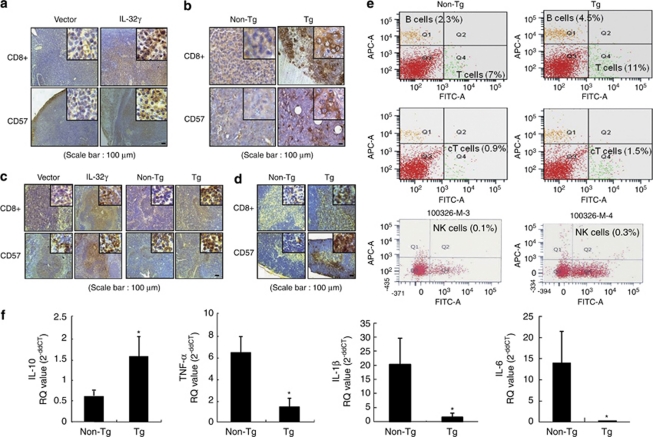
Figure 8.
Effect of IL-32γ on the infiltration of CD8+ T cells and NK cells into tumor tissues and immune organ tissues and on cytokine levels in tumor tissues. (a–d) Immunohistochemistry was used to determine the level of CD8+- and CD57-reactive cell number in tumor sections and immunity-related organs, as described in Materials and methods. Shown are the expression patterns of CD8+ and CD57 in the tumor sections of nude mouse xenografts (a) and IL-32γ transgenic mice (b), as well as in the spleens (c) and thymuses (d) of IL-32γ transgenic mice. The images shown are representative of three sections from each mouse (n=3). Each image and band is representative of three independent experiments. (e) Subpopulation of immune cells determined after FACS analysis, as described in detail in Materials and methods. The values in each area are the average subpopulation of immune cells (NK cells and CD8+ cells). Each image is representative of three independent experiments. (f) The levels of IL-10, TNF-α, IL-1β and IL-6 in the tumor tissues of transgenic mice (n=3) were measured using quantitative real-time PCR, as described in Materials and methods. *P<0.05 compared with non-transgenic mice tumor tissues.

