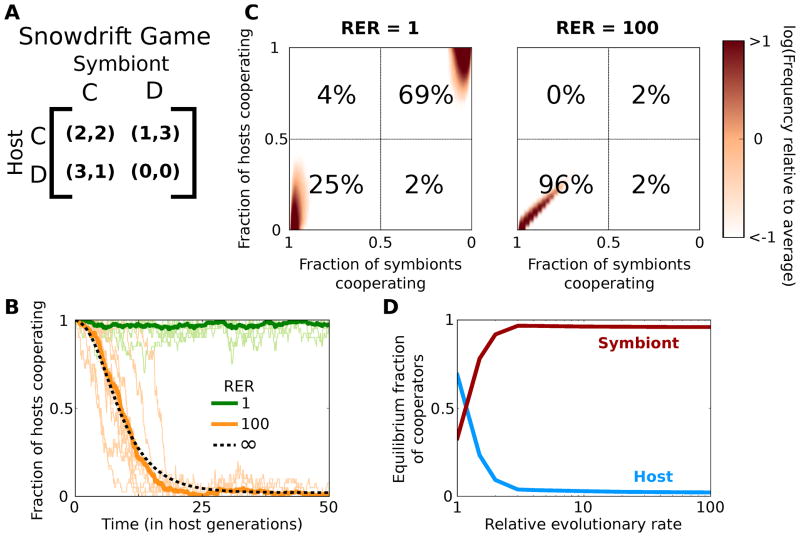
Figure 2.
The population reaches the sequential game equilibrium as the relative evolutionary rate (RER) of the symbionts increases. (A) The payout matrix used for the snowdrift game played in pairwise interactions between each host and its symbionts. Each player can either Cooperate (C) or Defect (D). The host and symbiont receive a payout equal to the first and second number in each pair respectively. Each entry was given an offset of 1 to account for basal growth rate. (B) Ten simulation runs with RER of 1 and 100 are in light colors, with their average in darker, thick green and orange lines respectively, and the infinite RER limit is shown in the dashed line. The equilibrium of purely cooperating hosts and defecting symbionts is stable when RER = 1, but the sequential game equilibrium is the only stable state as RER increases. (C) Heat maps of the equilibrium probability distribution. The x-axis is reversed to mirror the payout matrix. The numbers in each quadrant are the percent of individual host-symbiont interactions that are in that corner. (C–D) The population goes from being bistable when RER is 1, to nearly all of the hosts defecting and the symbionts cooperating as RER increases.

