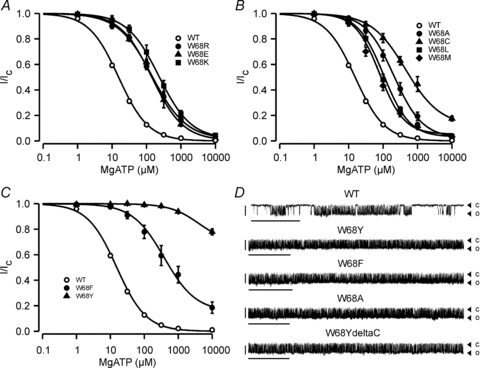
Figure 4. Effect of other mutations at position W68 on MgATP sensitivity.

A, mean relationship between [MgATP] and KATP channel current (I), expressed relative to the current in the absence of nucleotide (Ic) for WT (open circles, n = 26), homW68R (filled circles, n = 12), homW68E (filled triangles, n = 7) and homW68K (filled squares, n = 10) channels. The smooth curves are the best fit of eqn (1) to the data: WT (IC50 = 15 μm, h = 1.01), homW68R (IC50 = 146 μm, h = 0.88, a = 0.014), homW68E (IC50 = 142 μm, h = 0.95, a = 0.004), homW68K (IC50 = 229 μm, h = 0.93, a = 0.016). B, mean relationship between [MgATP] and KATP channel current (I), expressed relative to the current in the absence of nucleotide (Ic) for WT (open circles, n = 26), homW68A (filled circles, n = 6), homW68C (filled triangles, n = 6), homW68L (filled squares, n = 7) and homW68M mutants (filled diamonds, n = 5). The smooth curves are the best fit of eqn (1) to the data: WT (IC50 = 15 μm, h = 1.01), homW68A (IC50 = 206 μm, h = 1.05, a = 0.024), homW68C (IC50 = 454 μm, h = 0.87, a = 0.121), homW68L (IC50 = 104 μm, h = 1.16, a = 0.031), homW68M (IC50 = 80 μm, h = 1.22, a = 0.053). C, mean relationship between [MgATP] and KATP channel current (I), expressed relative to the current in the absence of nucleotide (Ic) for WT (open circles, n = 26), homW68F (filled circles, n = 11), and homW68Y (filled triangles, n = 8) channels. The smooth curves are the best fit of eqn (1) to the data: WT (IC50 = 15 μm, h = 1.01), homW68F (IC50 = 388 μm, h = 0.93, a = 0.153): that through the homW68Y data is drawn by eye. D, single-channel currents recorded at −60 mV from an inside-out patch expressing WT and homW68 mutant channels (as indicated). Closed (c) and open (o) current levels are indicated by triangles. Scale bars are 2 s (x-axis) and 5 pA (y-axis).
