
Figure 3. A small number of PF–PC synapses are formed onto spine-less dendrites of sg/sg PCs.
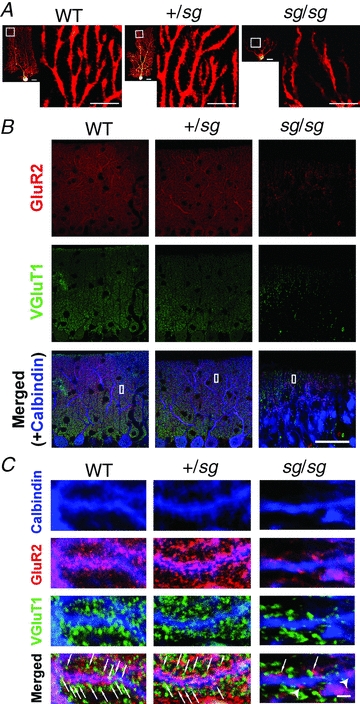
A, distribution of dendritic spines visualized by introducing biocytin into PCs. Small images are overviews of the visualized PCs (scale bar, 20 μm). Each larger image (scale bar, 10 μm) shows a magnified view of the region marked by a white square in the left-neighbouring small image. B and C, confocal images of triple immunofluorescence for GluR2 (red; a postsynaptic marker), VGluT1 (green; a presynaptic marker for PF synapses) and Calbindin (blue; a marker for PCs). Left, middle and right rows correspond to the images obtained from WT, +/sg and sg/sg cerebellar slices, respectively. The regions specified by white rectangles in B are magnified and rotated in C. Arrows and arrowheads in C indicate putative synaptic sites and isolated postsynaptic sites without presynaptic partners on PCs, respectively. Scale bars represent 50 μm in B and 2 μm in C.