
Figure 5. Expression levels of mGluR1 and GluR2/3 are reduced in sg/sg cerebellum.
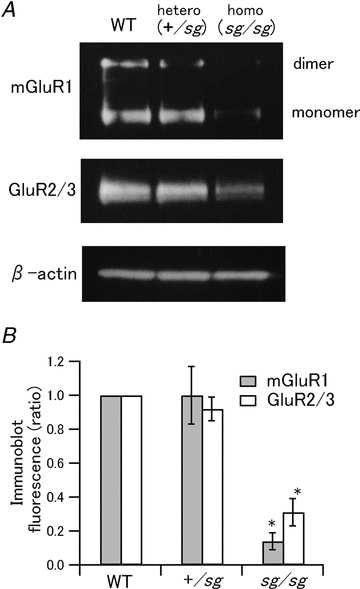
A, Western blot analysis showing expression levels of mGluR1 and GluR2/3 in WT, +/sg and sg/sg cerebella. Immunoblots of β-actin are shown as controls for the amount of total protein loading in each lane. B, quantified expression levels of mGluR1 (grey bars) and GluR2/3 (open bars) are normalized to the levels in WT mice (WT versus sg/sg and +/sg versus sg/sg, *P < 0.05).