
Figure 7. No DHPG-induced current and low expression levels of TRPC3 in sg/sg PCs.
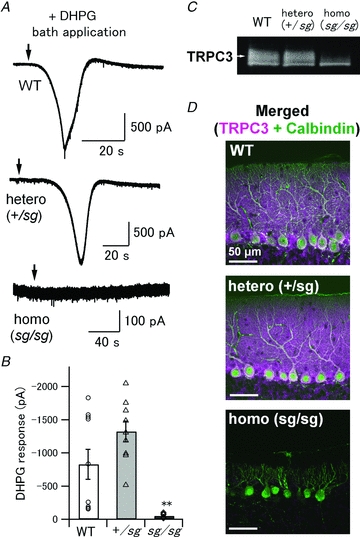
A, an mGluR1 agonist, DHPG (100–200 μm), was bath-applied to activate all the mGluRs on PCs. Each arrow indicates the time point when the DHPG solution reached the recording chamber. B, pooled data of DHPG-induced responses in WT, +/sg and sg/sg PCs. Symbols and bar graphs correspond to individual data points and mean values of the peak amplitudes, respectively (WT versus sg/sg and +/sg versus sg/sg, **P < 0.001). C, immunoblots showing expression levels of TRPC3 in WT, +/sg and sg/sg cerebella. A white arrow indicates the expected MW of TRPC3 (∼100 kDa). D, confocal images of the cerebellar slices double-immunostained for TRPC3 (magenta) and Calbindin (green). White signals indicate colocalization of TRPC3 with Calbindin, which means that TRPC3 proteins are present in PCs. Scale bars represent 50 μm.