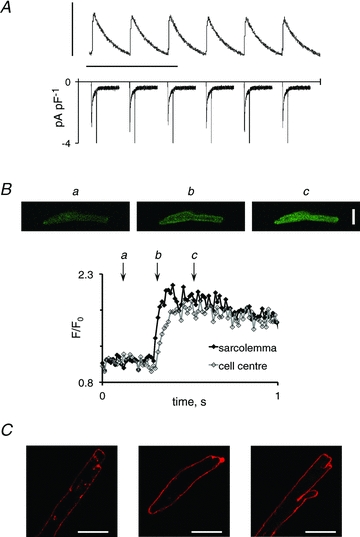
Figure 1. The uniform beat-to-beat response.

A, uniform calcium transients elicited by consecutive membrane depolarizations at 0.25 Hz (top) and the corresponding membrane currents (bottom). Vertical and horizontal scale bars represent 0.5 a.u. and 10 s, respectively. B, consecutive images recorded before, 20 and 120 ms after depolarization of a myocyte with a uniform beat-to-beat pattern are shown in the top panel. Quantification of calcium at the sarcolemma and in the cell centre is shown in the superimposed traces in the bottom panel. Letters indicate the time when the images in the top panel were recorded. C, representative examples of di-4-ANEPPS-stained human atrial myocytes. Staining was performed in myocytes isolated from six patients. Scale bars represent 20 μm.
