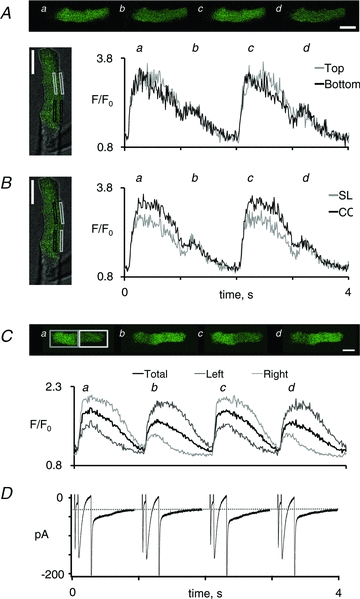
Figure 4. Subcellular calcium handling during alternating beat-to-beat responses.

A, four consecutive images showing alternation in the peak calcium transient induced by elevation of the stimulation frequency from 0.5 to 1 Hz. A combined transmission and confocal calcium image of the myocyte is shown on the left, with indication of the regions used for measurement of the calcium signal. Average signals from the top (grey rectangles and traces) and bottom part of the myoyte (black rectangles and traces) are shown on the right. B, average calcium transients in the subsarcolemmal region (SL; grey rectangles and trace) and in the central region of the myocyte (CC; black rectangles and trace). C, four consecutive images showing discordant alternations in the peak calcium transient recorded in the left and the right half of a myocyte. The resulting calcium transients in the left half (dark grey trace), the right half (light grey trace) and the entire myocyte (black trace) are shown below. D, simultaneously recorded ionic currents. The dotted line indicates the holding current at –80 mV. Notice the concordant alternation in the tail current and the global calcium transient. White scale bars represent 20 μm. The frame rate was 100 Hz, and images shown are the average of four consecutive images.
