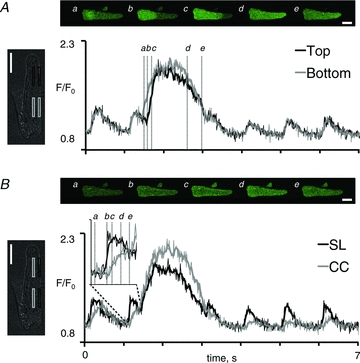
Figure 5. Subcellular calcium handling during irregular beat-to-beat responses.

A, image sequence illustrating the propagation of a calcium wave along the longitudinal cell axis. The regions used to measure calcium signals in the myocyte are shown on the left, and average signals from the grey and black rectangles are shown on the right. B, five consecutive images showing the small calcium transient elicited immediately before the calcium wave. The regions used to measure calcium transients signals in the subsarcolemmal and central region are indicated on the myocyte shown on the left, and the corresponding subsarcolemmal (SL; black trace) and central calcium transients (CC; grey trace) are shown on the right. White scale bars represent 20 μm. The inset illustrates the subsarcolemmal and central calcium transients recorded immediately before the onset of the calcium wave. Letters indicate the time where images in the top panel were recorded. The thin lines represent the calcium signal recorded at a frame rate of 100 Hz. The thick lines and the image sequences in A and B were obtained by averaging three consecutive images.
