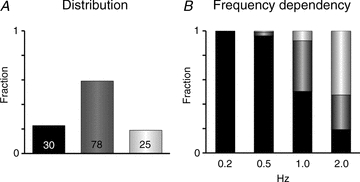
Figure 6. Distribution and frequency dependency of the beat-to-beat response in a myocyte population.

A, fraction of 133 myocytes presenting uniform, alternating or irregular beat-to-beat responses when the stimulation frequency was increased from 0.2 to 2 Hz. Numbers indicate the number of myocytes with the corresponding pattern. B, distribution of uniform, alternating and irregular beat-to-beat responses at stimulation frequencies of 0.2, 0.5, 1.0 and 2.0 Hz (indicated below columns).
