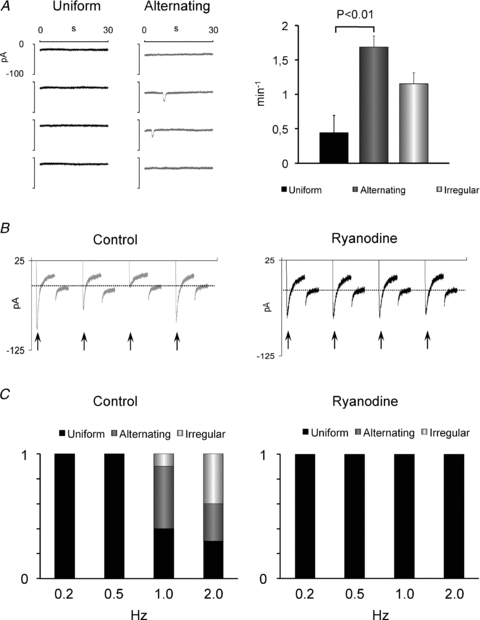
Figure 8. Effect of the rate of spontaneous calcium release on the beat-to-beat response.

A, spontaneous ITI recordings in myocytes with uniform (black trace) and alternating beat-to-beat patterns (grey trace). The spontaneous ITI frequency is shown on the right for myocytes with uniform, alternating or irregular beat-to-beat responses. Significant P values are given above bars. B, membrane currents recorded from a myocyte with an irregular beat-to-beat response before (control) and a uniform response after inhibition of SR Ca2+ release with 100 μm ryanodine. Arrows indicate the peak ICa for each depolarization pulse. Dashed lines indicate the holding current. C, frequency-dependent distribution of the beat-to-beat responses in control conditions (on the left) and in the presence of 100 μm ryanodine (on the right). Stimulation frequencies are given below columns.
