
Figure 9. Dependency of the beat-to-beat response on SR calcium loading.
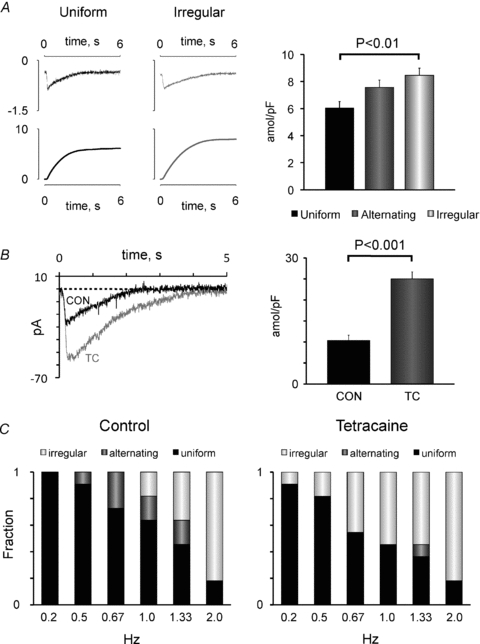
A, representative current traces elicited by rapid caffeine application (top panel) and their time integral (bottom panel) recorded in myocytes with uniform (black trace) and irregular beat-to-beat patterns (grey trace). The right panel shows the caffeine-releasable calcium load in myocytes with uniform, alternating or irregular beat-to-beat responses. Significant P values are given above bars. B, superimposed currents induced by rapid caffeine application before (CON) and after exposure of a human atrial myocyte to 50 μm tetracaine (TC). The average caffeine-releasable calcium load (n = 11) before and after exposure to tetracaine is shown on the right. The P value is given above the bars. C, frequency-dependent distribution of the beat-to-beat responses in control conditions (on the left) and in the presence of 50 μm tetracaine (on the right). Stimulation frequencies are given below columns.