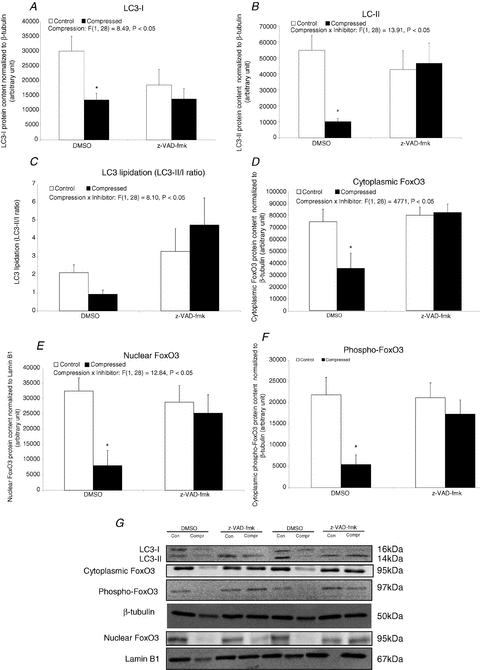
Figure 10. Autophagic regulatory factor: LC3-I, LC3-II, FoxO3 and phospho-FoxO3 protein expression.

A–F, protein abundances of LC3-I (A), LC3-II (B), FoxO3 (D and E), and phospho-FoxO3 (F) were determined by Western blotting. LC3-I and LC3-II were measured in cytoplasmic fraction whereas FoxO3 and phospho-FoxO3 were determined in both cytoplasmic and nuclear fraction. LC3 lipidation is shown as the ratio of LC3-II/LC3-I (C). Data are net intensity × resulting band area and expressed in arbitrary units. Results of LC3-I and LC3-II, cytoplasmic FoxO3 and phospho-FoxO3 were normalized to corresponding β-tubulin signal whereas nuclear FoxO3 was normalized to corresponding Lamin B1 signal. G, two sets of representative blots are shown. Con, control; Compr, compressed. Data are presented as means ± SEM with significant levels set at *P < 0.05, compressed muscle compared to the corresponding control muscle in DMSO and z-VAD-fmk groups. The main effects of compression, inhibitor and interaction (compression × inhibitor) in these animals were analysed using a 2 × 2 ANOVA.
