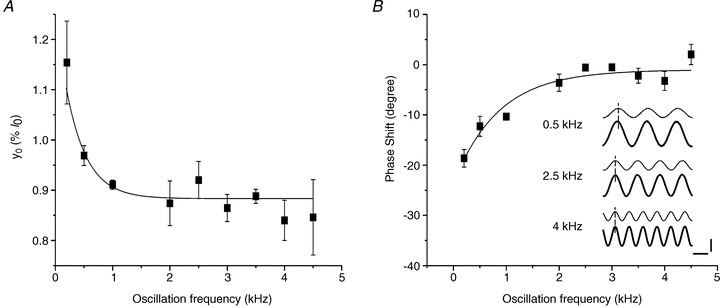
Figure 1. Both y0 and phase shift between length and force decrease with oscillation frequency up to 2 kHz.

A, the line fitted on the experimental y0 data was the best fitting (R = 0.81) with the following single exponential decay equation: y0 = 0.39 ± 0.13 exp (–frequency/358 ± 87) + 0.88 ± 0.01. B, phase shift between length and force as function of oscillation frequency. Force leads length at frequency below 2 kHz, but it is in phase at higher frequencies. Mean ± SEM from experiments on 3 fibre bundles. Inset in B, typical records of force (thick traces) and length (thin traces) sinusoidal oscillations at 0.5 kHz (upper traces), 2.5 kHz (intermediate traces) and 4 kHz (lower traces) at tetanus plateau. Dashed line is drawn at the peak of length. Note that the phase shift (13 deg) present at 0.5 kHz disappears at frequencies above 2 kHz. Horizontal calibration, 250 μs; vertical calibration, 0.2%l0 or 10%P0. Phase shift in all our records at and above 2.5 kHz, even at forces down to 0.3 P0, was never greater than 5 deg.
