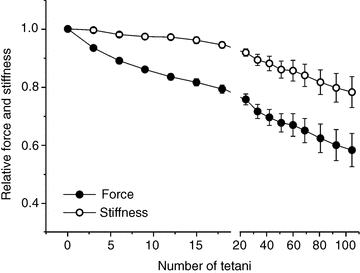
Figure 3. Tetanic force and fibre stiffness decrease at different rates during the induction of fatigue.

Tetanic force (filled circles) and fibre stiffness (open circles). The relatively high dispersion of data during the late period of fatigue is due to the variability of the extent of force depression in different fibres during this phase. This dispersion greatly decreases when stiffness data are plotted as a function of force as in Fig. 6. Data are expressed as a fraction of the values recorded during the first tetanus and are mean ± SEM; n = 10 (2 single fibres and 8 bundles).
