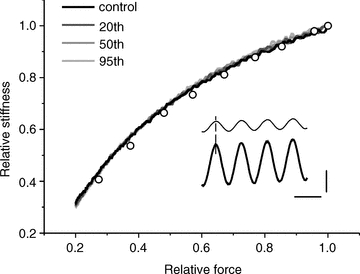
Figure 5. Tendon properties do not change during fatiguing protocol.

Typical tension–stiffness relations of a tendon preparation during the first, 20th, 50th and 95th stretches of a series of 105 stretches applied to simulate the effects of fatigue. All the 105 traces are almost perfectly superimposed with negligible difference between them; only 4 are plotted for clarity. The same results were obtained in all three experiments made. Tension and stiffness are expressed relative to the values at tension peak which was similar to the tetanic tension developed by our active preparation. The procedure to calculate stiffness continuously during the whole tension rise is described in the Methods section. Open circles show the calculated tendon stiffness from the data taken on the tetanus rise of Fig. 4B, normalized to 1. Note the very good similarity with data measured on tendon preparation. Inset, length (thin trace) and force (thick trace) sinusoids at 2.5 kHz are in phase. Records taken at tension of 62% of maximum. Vertical calibration, 8% of maximum tension or 0.7% of preparation length (440 μm); horizontal calibration, 400 μs.
