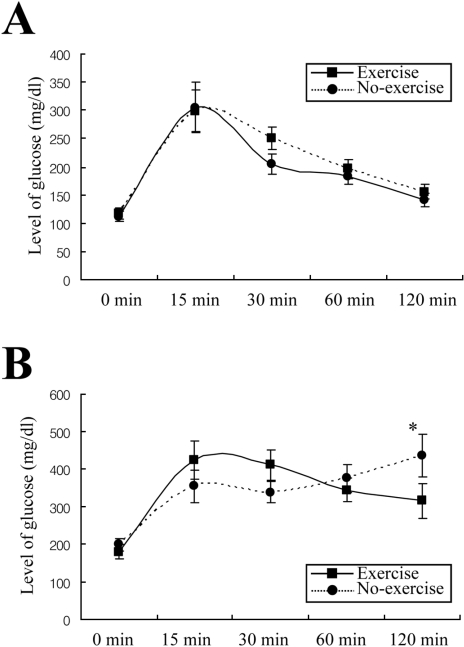
Figure 3.
Post-prandial intraperitoneal glucose tolerance response in W/S (A) and GK (B) rats. Glucose was intraperitoneally injected (1.5 g/kg body weight) and blood glucose was determined at indicated intervals. Four or five rats per group were assayed in the IPGT test. The data represents the mean±SD from triplicates. *P<0.05; significant difference between W/S and GK rats.

