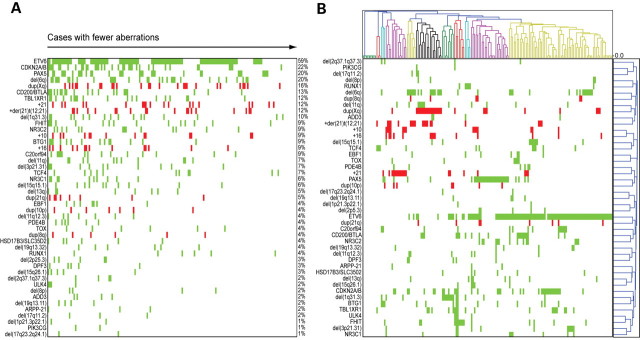
Figure 1.
Recurrent copy number changes in ETV6/RUNX1-positive pediatric ALLs. (A) The 45 recurrent copy number aberrations (CNAs) and 164 ETV6/RUNX1-positive ALLs sorted by frequency and number of recurrent aberrations, respectively. The cases are sorted with decreasing number of recurrent CNAs from left to right, and the CNAs are sorted by frequency from top to bottom. A green box indicates loss of material and a red box indicates gain of material. (B) Hierarchical clustering using 1-Pearson correlation and average linkage of the 164 ETV6/RUNX1-positive ALLs (top graph) and the 45 recurrent CNAs (right graph). Patients are indicated above the graph and CNAs on the left. A green box indicates loss of material and a red box indicates gain of material. Eleven distinct clusters of patients are detected; these are indicated in alternating colors of green, red, blue, purple, yellow and black.

