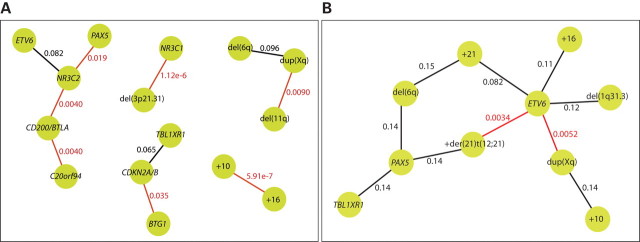
Figure 2.
Positive and negative correlations between copy number abnormalities. Dissimilarity scores were calculated for all possible pairs of copy number abnormalities, and the 1% largest and the 1% smallest dissimilarities are illustrated here as nodes with a connection. The nodes represent copy number abnormalities, and the connections represent either positive or negative associations between the copy number changes. The q-value, based on chi-square tests, for each association is indicated at the connection. Statistically significant associations (q < 0.05) are indicated in red. (A) Illustration of positive associations between copy number abnormalities. In this data set, the strongest association is seen between gains of chromosomes 10 and 16 (q = 0.00000059). (B) Illustration of negative associations between copy number abnormalities. Deletion of ETV6 is significantly negatively associated with both dup(Xq) (q = 0.0052) and an additional copy of the der(21)t(12;21) (q = 0.0034).

