
Figure 1.
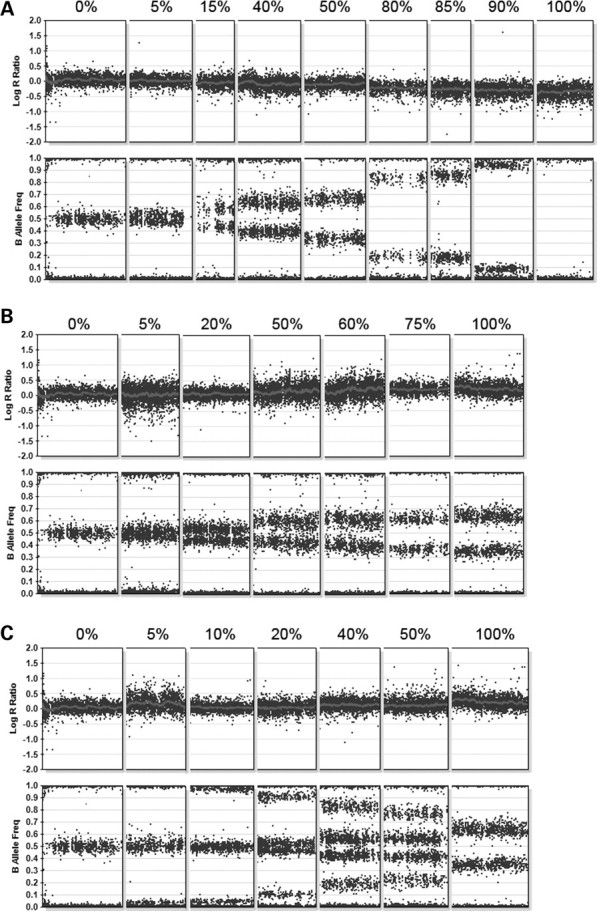
Composite array results for mosaic deletions and duplications. This figure shows segments from different chromosomes illustrating mosaicism from 0–100%. For all figure parts, the percentages above the data indicate the level of mosaicism, with 0% representing a patient with normal copy number, and 100% representing a non-mosaic patient. (A) BeadStudio output for nine patients with varying levels of mosaicism for deletions involving autosomes. (B) BeadStudio output for seven patients with varying levels of mosaicism for trisomies. The pattern of B allele frequency indicates that the same two haplotypes present in the euploid cell line are also present in the triploid cell line at altered ratios. (C) BeadStudio output from seven patients with varying levels of mosaicism for trisomies. The additional B allele frequencies in the mosaic patients represent genotypes present in the trisomic cell line that are not present in the euploid cell line, suggesting a meiotic origin of the trisomy.