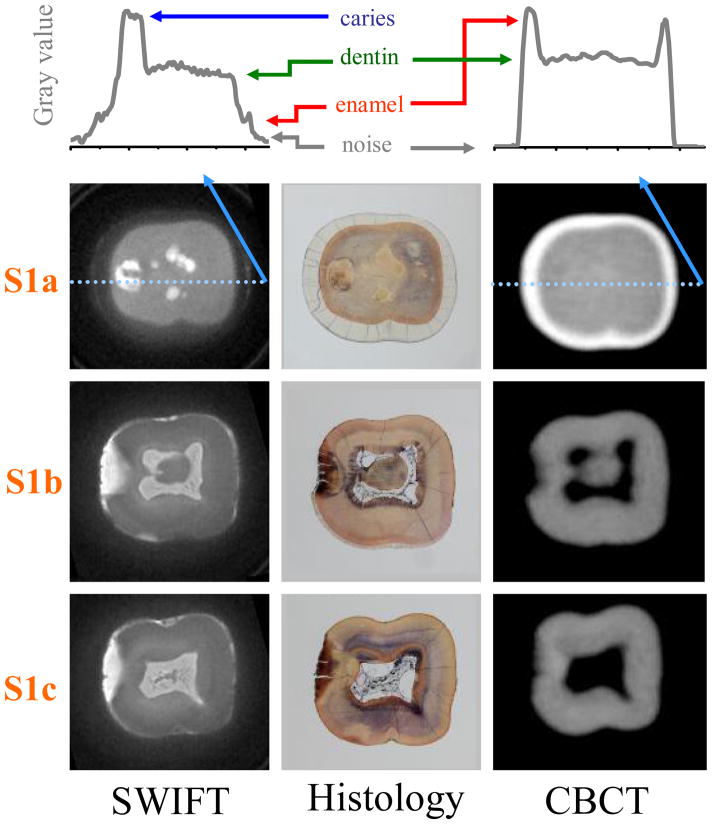
Figure 2.
Three cross-sectional slices of Tooth 1 (marked as S1a, S1b and S1c in Figure 1) are presented. Graphs located on the top of figure with arbitrary gray value present the profiles of slice S1a at the position depicted with a light blue line. The colored arrows delineate the surface of the tooth enamel (red), sound dentin (green) and the signal level of caries (dark blue), respectively. Note that the signal from enamel tissue in SWIFT image is clearly greater than background noise (black arrows). The presence of occlusal caries is observed in S1a within the SWIFT and non-decalcified histology sections, which is the gold-standard measure, but not observed in the CBCT scan. The extent of the interproximal caries towards the dental pulp, in S1b and S1c, are more completely delineated in the SWIFT sections than the CBCT when compared to histology. The slice thickness is equal to 98 μm for SWIFT and 200 μm for CBCT images.

