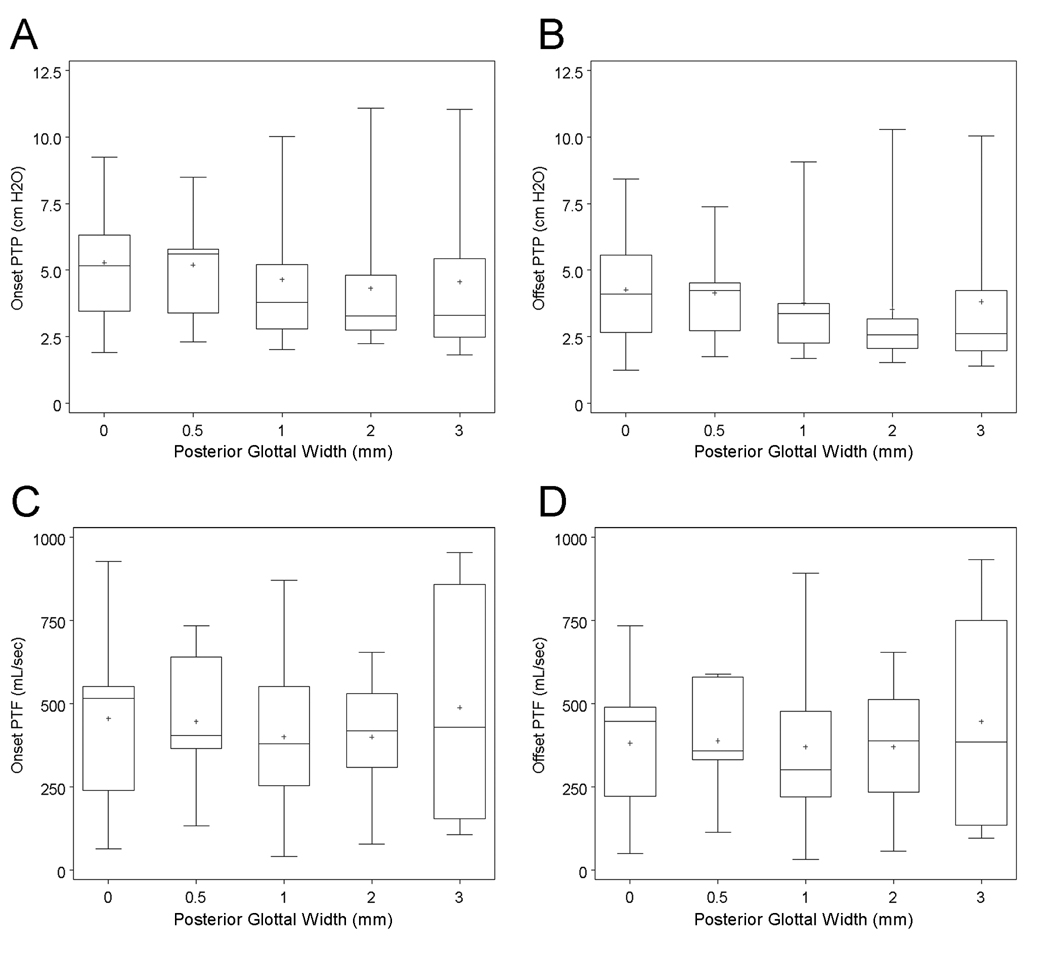
Figure 3.
Box plots of (A) PTPonset, (B) PTPoffset, (C) PTFonset, and (D) PTFoffset data as a function of posterior glottal width. The lower and upper boundaries of each box denote the 25th and 75th percentiles. Horizontal bar within the box marks the median, and the cross marks the mean. Whiskers show the maximum and minimum values.

