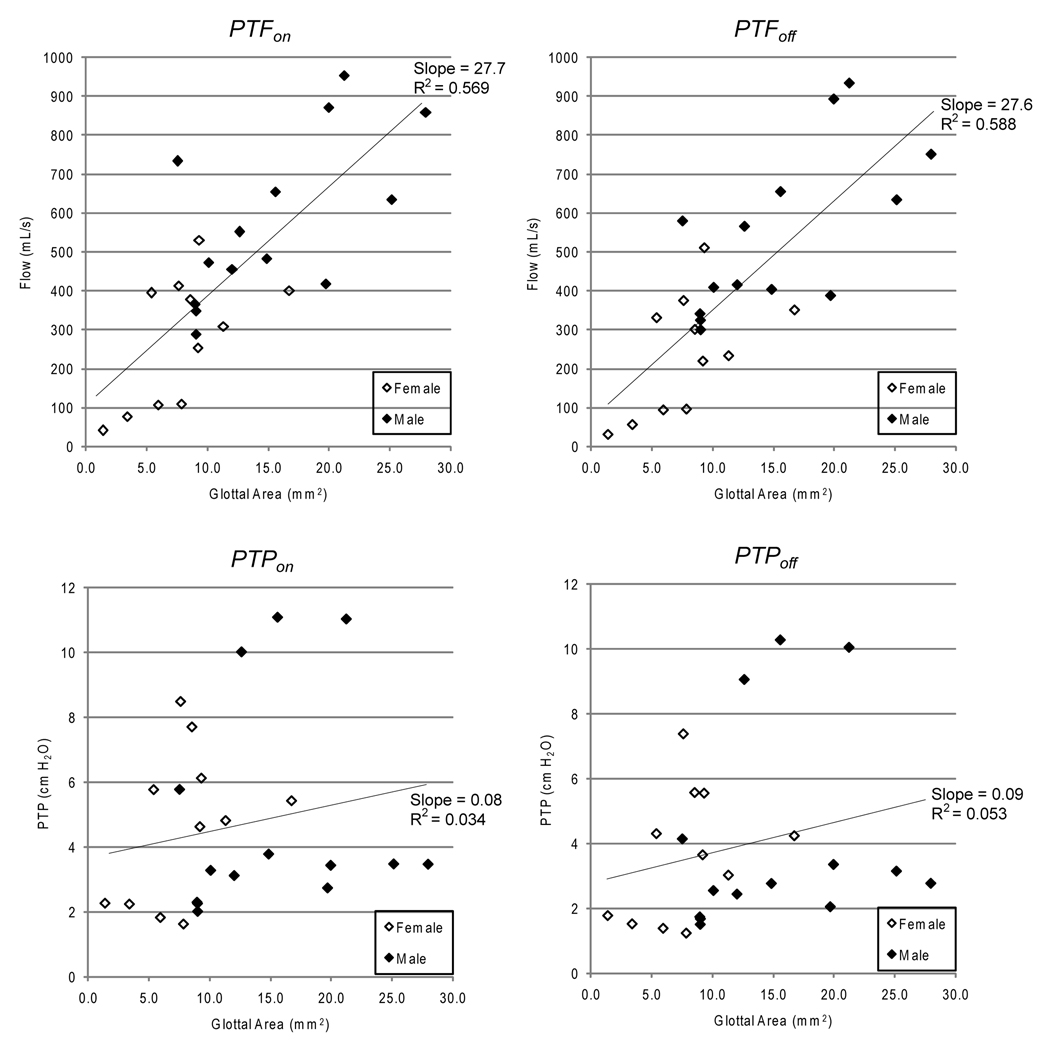
Figure 4.
Scatter plots of PTP and PTF vs. glottal area. Data from female larynges are shown with open symbols, and those from male larynges are shown with solid symbols. The line in each graph represents the linear least-squares fit, and the associated slope and coefficient of determination (R2) are shown.

