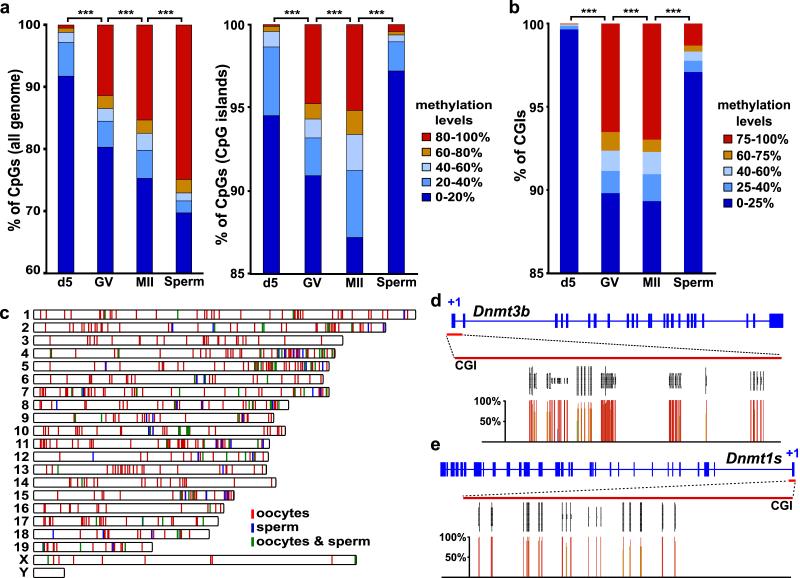
Figure 1. DNA methylation landscape in oocytes and sperm determined by RRBS.
a-b, Distribution of CpG methylation levels across the genome (a, left), within CGIs (a, right), and CGI methylation (b), in immature (d5), mature (GV and MII) oocytes and sperm (***: p<0.001, χ2 test). The number of CpGs and CGIs analysed is indicated in Suppl. Fig 1b. c, Chromosome distribution of the 1062 CGIs methylated in oocytes and 185 CGIs methylated in sperm (100 CGIs in both). d, CpG methylation levels (percentage of all cytosines called methylated) at the Dnmt3b and Dnmt1s promoter CGIs in GV oocytes. The grey vertical lines represent the sequencing read depth of individual cytosines; below, percentage methylation of the corresponding CpGs is represented by coloured vertical lines.

