
Figure 2.
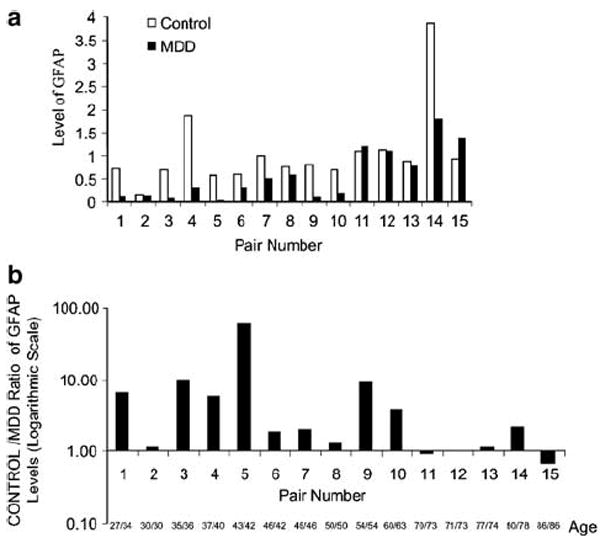
Graph of the optical density ratio of GFAP to actin (GFAP level) for all subjects arranged in pairs of control and depressed subjects. Plot (a) shows the GFAP level of all the subjects grouped by matching pairs. To appreciate the magnitude of the difference in individual pairs, the ratios of GFAP level in the control subject to the level in the matching MDD subject for all pairs are shown in (b) with a logarithmic scale since the GFAP level was as much as 50 times larger in the control than in the MDD subject. Only Pairs #11 and 15 had values lower than 1 for this intergroup ratio. For each pair, the age to the left of the slash corresponds to the control subject and the age to the right of the slash corresponds to the MDD subject.