
Fig. 4.
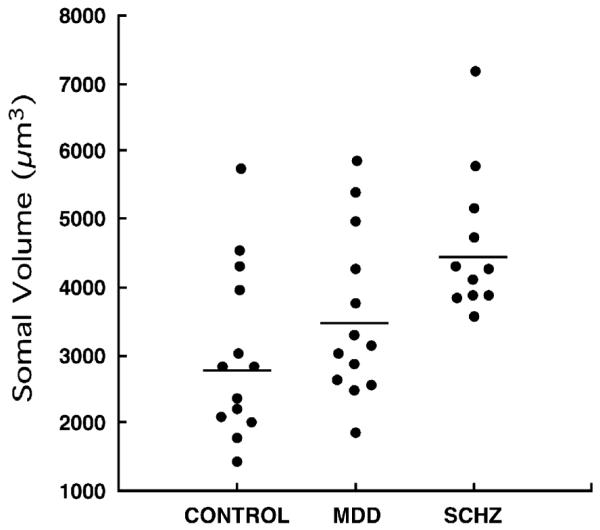
Plots showing the distribution of the individual geometric means of somal volumes of NF200-immunoreactive neurons in the control, major depressive disorder (MDD), and schizophrenia (SCHZ) groups. The horizontal bars represent geometric means for each diagnostic group.