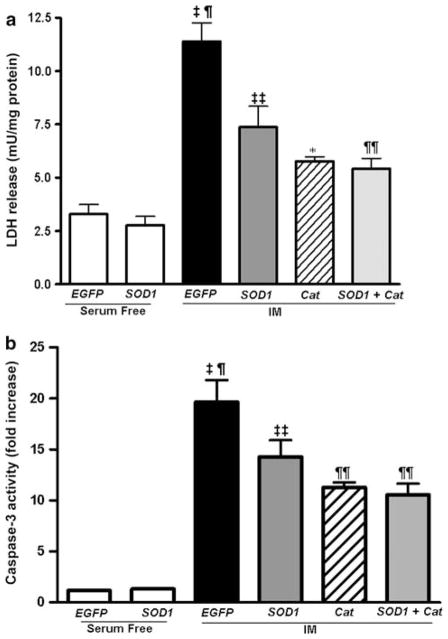
Fig. 6.
Effects of catalase on cytotoxicity and caspase-3 activity in ATP depleted LLC-EGFP and LLC-SOD1 cells. a LDH assay in LLC-SOD1 and EGFP cells with or without catalase following 4–2 h ATP depletion-recovery. Results are means ± SEM. N = 4–9. ‡ P < 0.001 EGFP IM versus EGFP serum free, SOD1 serum free; ¶ P < 0.01 EGFP IM versus SOD IM, Cat IM and SOD + Cat IM; ‡‡ P < 0.001 SOD IM versus EGFP serum free and SOD1 serum free; * P < 0.01 Cat IM versus EGFP IM, EGFP serum free and SOD1 serum free; ¶¶ P < 0.01 SOD + Cat IM versus EGFP SF and SOD1 SF. b Caspase-3 activity in LLC-SOD1 and EGFP cells with or without catalase following 4–2 h ATP depletion-recovery. Results are means ± SEM. N = 3–9. ‡ P < 0.001 EGFP IM and SOD1 IM versus EGFP serum free and SOD1 serum free; ¶ P < 0.01 EGFP IM versus SOD IM, Cat IM and SOD + Cat IM; * P < 0.01 Cat IM versus EGFP IM, SOD1 serum free and EGFP serum free; ¶¶ P < 0.01 SOD + Cat IM versus EGFP IM, SOD1 serum free and EGFP serum free

