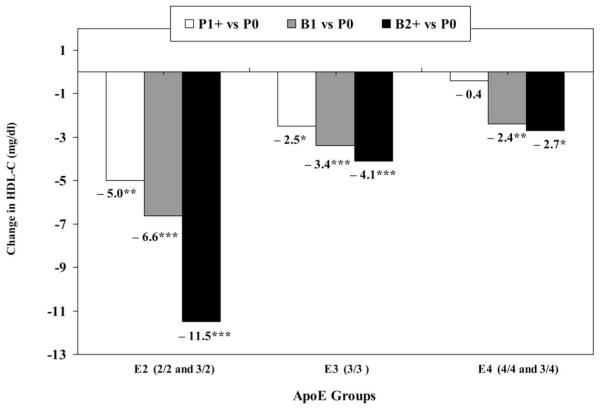
FIG. 1.
Net differences in fully adjusted mean change in HDL-C levels (mg/dl) between follow-up pregnancy groups vs. the referent group by ApoE groups. P0, no pregnancies (referent]); P1+, 1 or more short pregnancies (no births); B1, one birth; B2+, two or more births. Pairwise comparisons to referent group (P0); significance levels: *p < 0.05; **p < 0.01; ***p < 0.001).

