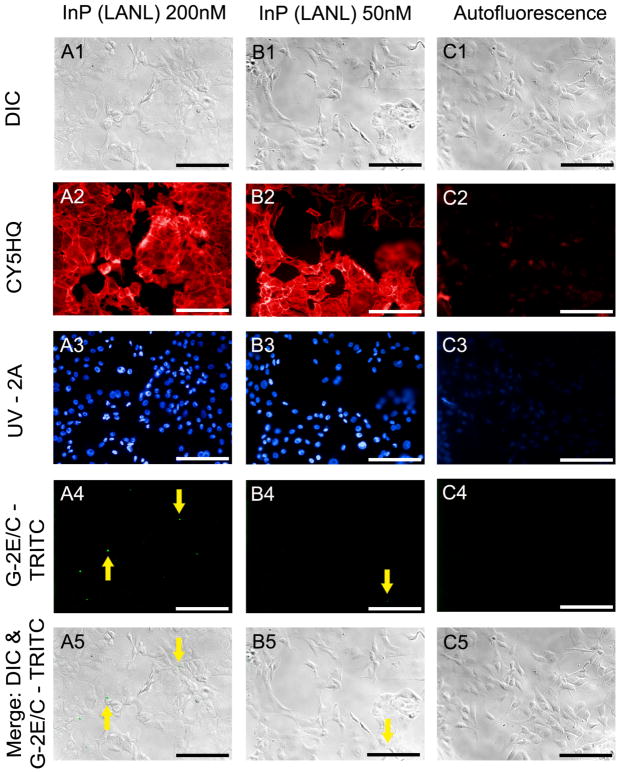
Figure 3. Epifluorescence and DIC images of heterostructured InP QDs.
Epifluorescence imaging permitted the qualitative and quantitative comparison of cells incubated for 24 hours with either 200nM of InP (LANL) 578 QDs (A), 50nM of InP (LANL) 578 QDs (B), and control cells not incubated with QDs (C). A qualitative assessment of cellular morphology was completed by evaluating DIC (A1-C1) and epifluorescence (A2, B2) images of Alexa Fluor® 680 phalloidin. A quantitative assessment of cellular association with QDs was carried out by dividing the total number of cells associated with QDs detected in merged images (A5-C5) by the total number of cell nuclei labeled with Hoechst 33342 (A3, B3). All images were captured using a 20x air objective, NA= 0.50. Scale bar = 50 μm.

