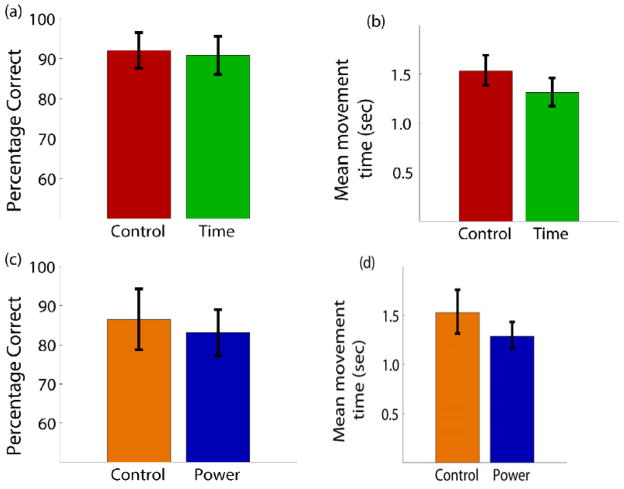
Fig. 13.
a) The percentage of correct trials for the two conditions of laboratory control (75–105 Hz) and time-domain sampling. Percentages are the total correct targets out of the number of trials where one of the two targets was selected. b) Mean movement time to select one of the targets for the same two conditions. c) Percentage correct for control (80–96 Hz) and on-board power estimation. d) Mean movement time for the two conditions.

