Fig. 1.
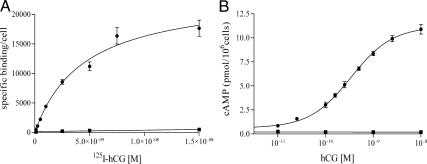
Characterization of the model system of transformed s49 ck cell lines. A, Saturation-binding curve. Specific binding was measured after a 5 h incubation with 125I-hCG at 37 C for the mock (■) and LHR+ s49 ck (●) cells, and the derived Kd and Bmax values for the LHR+ cells are 4.5 ± 0.4 nm and (24 ± 1.2) × 103 receptors per cell, respectively. B, Dose-response curve. The cAMP response was measured after a 30-min incubation with hCG (37 C) of the LHR+/mock (■) and LHR+/Gαs+ (●) transformed cell lines, and the values found for EC50 and Rmax for the LHR+/Gαs+ cell line are 0.34 ± 0.1 nm and 11.2 ± 0.2 pmol/106 cells, respectively. Data are presented as mean ± sem.

